Moving Average Convergence Divergence
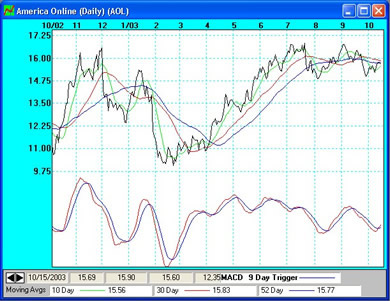
This study is displayed by selecting MACD from the Indicator Menu. This
will cause the program to display the MACD along with its trigger at the bottom
of the screen. This routine takes and subtracts the value of the first moving
average from the second moving average and plots the resulting figures. The
trigger line is calculated by taking the trigger value as a moving average of
the resulting figures.
A buy signal is indicated by the line that represents the difference between the
8 bar and the 17 bar moving average crossing above the trigger line, which is a
9 bar exponential average of the first line.
A sell signal is generated by the line that represents the difference between
the 12 bar and the 25 bar moving average crossing below the trigger line, which
is a 9 bar exponential average of the first line.
You can set up these sets of moving averages ahead of time for easy access.
You may can access the screen to change the trigger value from the chart by
selecting Modify Study Variables from the Tools Menu. A 9 day trigger seems to
be the most common trigger used.
Changing Moving Averages
There are three sets of moving averages that may be used when calculating
the MACD. The default which may be accessed by selecting Master Moving Average.
Optional set number 1 accessed by selecting Alternate Moving Average Set 1 and
optional set 2 which may be accessed by selecting Alternate Moving Average Set
2. This will come in handy due to the fact that MACD buy signals use a
different set of criteria over the MACD Sell signals.
The buy signals use an 8 day and 17 day exponential average whereas the sell
signals use a 12 day and a 25 day exponential average. These can be setup as
your two alternate sets of moving averages along with the trigger value above by
selecting Modify Study Variables from the Indicator Menu. You will want to enter
the lowest moving average in the first moving average and the higher moving
average in the second moving average for each pair. That is to say that in the
first alternate set of moving averages you will want to enter 8, 17 and 0
respectively, while in the second alternate set of moving averages you will
enter 12, 25 and 0 respectively.
Back to Stock Indicators
|