Momentum
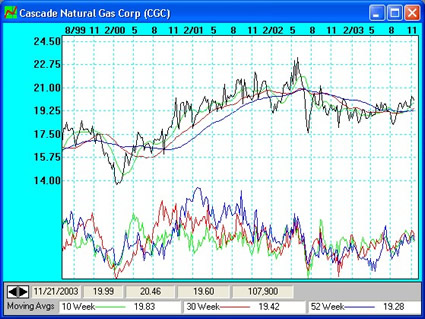
This selection is used to show you a visual representation of the price
momentum of the selected stock or equity.
There will be up to three momentum lines plotted. The range of these
momentum calculations are based on the figures that you entered under the Moving
Average fields in the Equity Master record for the equity that is selected. Each
momentum plot point is calculated by dividing the price at the point of
calculation by the price of the time duration of the three moving averages. If,
for instance, your Moving Averages are 11, 30 and 52. Then, the first momentum
would be calculated by taking the price at the current plot position and
dividing it by the price 11 weeks earlier. The second and third momentum
calculations would use the price 30 weeks prior and 52 weeks prior to the
current position, respectively.
If the momentum lines are moving above 1 and rising, then the price is gaining
momentum. We want to watch first for the shortest duration's change, then the
second longest duration's momentum change and, finally, the longest duration's
change.
Review this chart each week along with the other charts to get the overall
picture of what is going on in the market.

Back to Stock Indicators
|
