Moving
Average Indicator
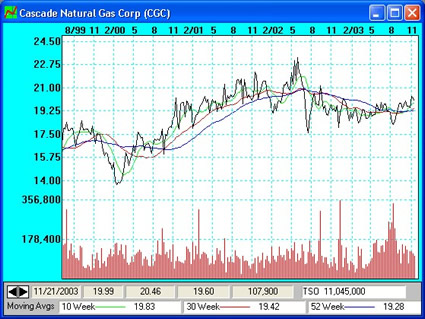
The Moving Average (MA) is one of the basic technical tools used. It is used
in the determination of individual stock trends and changes in an equities
direction. The MA is by far the most important technical tool for determining
long-term trends.
The flexibility given in the Equity Master Maintenance screen allows you
to change the values given for the duration of each of the three moving averages
so that each equity that you are tracking can have the optimal set of Moving
Averages for its trend information.
One of the purposes of Moving Averages is to smooth out the chart by
averaging the week to week volatile price swings of the equity being tracked.
Due to this smoothing, the moving average becomes an area of support in a rising
market and resistance in a declining market.
Moving averages are also used to indicate and confirm that a change in the
trend of an equity has taken place. This is indicated by the price crossing over
the moving average, also known as a violation of the moving average. Multiple
Moving Averages may be used to see how they interact with each other over a
period of time. These are charted together with the prices to give an overall
performance picture of the equity being studied.
The types of moving averages are listed below:
- Simple Moving Averages
- Advanced Moving Averages
- Centered Moving Averages
- Exponential Moving Averages
There are three different sets of three moving averages.
- Master Moving Average is used for selecting the moving average
durations that you have selected for the selected issue.
- Alternate Moving Average Set 1 is one alternate set of moving
averages that apply across the board.
- Alternate Moving Average Set 2 is the other alternate set of moving
averages that apply across the board.
Back to Stock Indicators
|