On Balance Volume
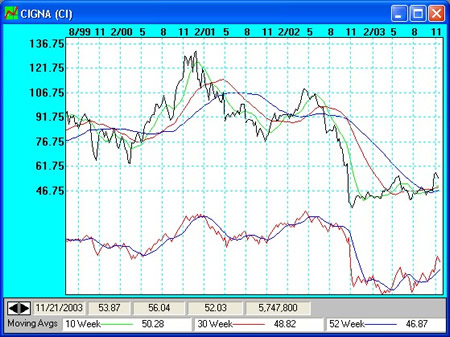
To chart the On-Balance Volume line with the High Low Close chart just
select On Balance Volume from the Indicators Menu. This will cause the
On-Balance indicator for the selected issue to be plotted at the bottom of the
screen.
This indicator is calculated by accumulating the volume when the price has
advanced from the previous days close and subtracting the volume when the price
is down from the previous day.
The resulting numbers are plotted so that you can compare the On-Balance Volume
(OBV) line to the Price action. The theory behind this indicator is that if the
issue is under accumulation the OBV line will be rising and conversely if the
issue is undergoing distribution the OBV line will be declining.
Watch out for Divergence!
What you want to watch out for is a divergence between the price action
and the OBV line. If the price action is rising, but the OBV line is declining
or flattening out you could be seeing a reversal of the price. If the price is
declining and the OBV line is rising you could also see a reversal of price.
This indicator was widely used by Granville.
On-Balance Volume Moving Average
We have now included a moving average for the On-Balance indicator. The
duration of this moving average is set by the value of the Volume Moving Average
as indicated by the equity master record.

Back to Stock Indicators
|
