Home
Why you should own Investor's Advantage
ORDER NOW!
Stock Market Analysis
Stock Indicators
Daily Stock Market Barometer
Weekly Stock Market Barometer
Relative Strength Analysis
Retrieving Stock Market Quotes
About Us
Investment Related Books
Feedback and EMail
Useful Links
Financial Resources
DOWNLOAD DEMO
Your Security
Articles
Stock Selection and Market Timing
Relative Strength Analysis
Making Sense of Business and Financial News
Stock Market Trading

Here are some other interesting products:
The MasterTrader eBook
Your complete guide to active trading/day trading. Learn proven strategies and make money consistently! Click Here!

Sure Fire Trading
Trading systems, methods and signals. Who else want's to trade like a Pro?
Click Here!

Relative Strength

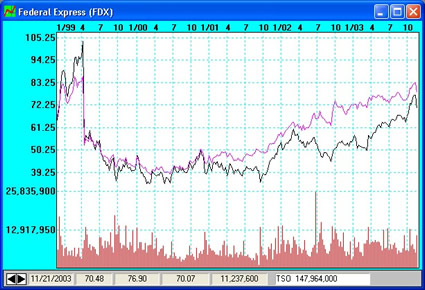
To chart how the stock is performing relative to a given index select Relative Strength from the Indicator Menu". This will toggle the Relative Strength on and off. Using the relative strength line (the magenta line just below the high low close bars) you can determine how the stock is performing relative to the rest of the market. If the stock is getting stronger relative to the market, the line will be rising. If the stock is getting weaker, the relative strength line will move lower.

Relative Strngth on Federal Express

Back to Stock Indicators

Home | Overview | ORDER NOW! | Stock Market Analysis | Stock Indicators | Daily Stock Market Barometer
Reletive Strength Stock Market Report | Weekly Stock Market Barometer | Retrieving Stock Market Quotes
Useful Links | Directories | Financial Resources | About Us | Investment Related Books | Feedback and Email

Content Management by Software Advantage Consulting Corporation