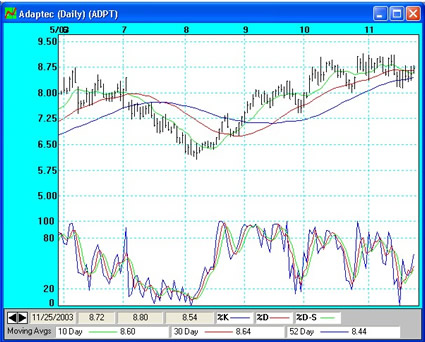
Stochastics
Stochastics is a method of calculating overbought and oversold conditions
for a given equity (as opposed to the market as a whole). This is a widely used
study throughout the technical analysis community. Generally an equity is
considered overbought when the %K indicator is above the 80% line and is
considered in a downtrend when the line crosses below the 80% line. Conversely,
it is also said that when the stochastic index is below the 20% line it is
considered oversold, and when it is crosses above the 20% line from that
condition it is in an uptrend.
There are exceptions to the above rule. If the %K line gets to 100% it can come
back down to 80% and bounce back up before proceeding down. You can see a
similar reaction in reverse when the %K indicator hits 0%. Compare the movement
of this index to the movement of the equity to get a better feel for the
workings of this oscillator.
Another indication to watch for is a divergence between the action of this index
and the movement of the price. When the price activity is achieving new highs
and the Stochastics index appears to have declining peaks it is an indication of
a divergence of trends. This is generally a warning signal of an impending
reversal of the stock.
You can find more information on this subject in the book, "Timing The
Market" by Weiss Research, Inc. P.O. Box 2923, West Palm Beach, FL 33402.
Back to Stock Indicators
|