Wilder's DMI
To view the Directional Movement Indicator (DMI) select Wilder's DMI from
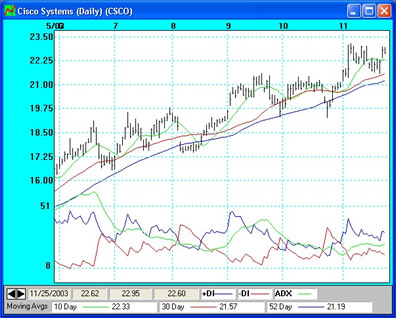
the Indicator Menu. This will calculate the directional movement indicators and
plot them at the bottom of your screen.
This is a type of oscillator to give you buy and sell signals on
individual issues. There are three lines plotted for this indicator: +DI, -DI
and the ADX. What you want to find is a stock that makes regular swings of price
from high to low and has a fair amount of time to ride the directional movements
of the price, so that you profit from the price action.
Bullish Signals - When the +DI crosses above the -DI and the ADX is
turning from either a peak or valley.
Bearish Signals - When the -DI crosses above the +DI and the ADX is
turning from either a peak or valley.
If you are not already familiar with this indicator, it is important to watch
this indicator before committing any funds to this method of investing.
If you would like further information on this indicator, you can send for the
book "New Concepts in Technical Trading Systems", by J Welles Wilder
Jr. from: Trend Research, P.O. Box 128, 5615 McLeansville Rd, McLeansville, NC
27301. (919) 698-0500
Back to Stock Indicators
|