Home
Why you should own Investor's Advantage
ORDER NOW!
Stock Market Analysis
Stock Indicators
Daily Stock Market Barometer
Weekly Stock Market Barometer
Relative Strength Analysis
Retrieving Stock Market Quotes
About Us
Investment Related Books
Feedback and EMail
Useful Links
Financial Resources
DOWNLOAD DEMO
Your Security
Articles
Stock Selection and Market Timing
Relative Strength Analysis
Making Sense of Business and Financial News
Stock Market Trading

Here are some other interesting products:
The MasterTrader eBook
Your complete guide to active trading/day trading. Learn proven strategies and make money consistently! Click Here!

Sure Fire Trading
Trading systems, methods and signals. Who else want's to trade like a Pro?
Click Here!

Wilders Relative Strength

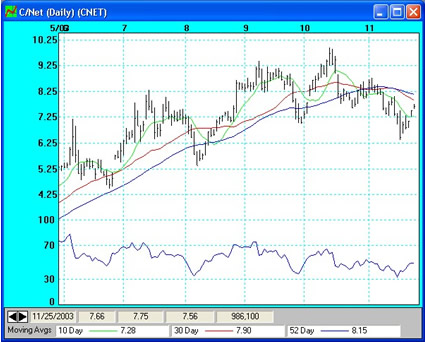
Wilders Relative Strength Index, RSI, is a study that gives you another view of the price movement of a stock. It is a type of momentum oscillator.

An indication of a TOP in the price is signified by the RSI crossing above 70 and conversely a BOTTOM in the price action is signified by the RSI dropping below 30.

Another aspect of this index to look for is divergence between the movement of the RSI and the price of the stock. This can be indicative of turning points in the equity.

Wilder's Relative Strength with C/Net

Back to Stock Indicators

Home | Overview | ORDER NOW! | Stock Market Analysis | Stock Indicators | Daily Stock Market Barometer
Reletive Strength Stock Market Report | Weekly Stock Market Barometer | Retrieving Stock Market Quotes
Useful Links | Directories | Financial Resources | About Us | Investment Related Books | Feedback and Email

Content Management by Software Advantage Consulting Corporation