Japanese Candlesticks
This is the method used by the Japanese for charting since the year 1750,
which is when the Japanese were starting to trade rice futures. The Japanese
Candlesticks may be viewed by selecting it from the Indicators Menu.
The other two options for charting price information is the
High Low Line Chart and the
Chart Stock Closing Price
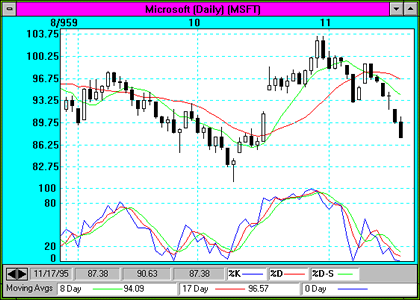
You will see by viewing the chart where the Candlestick name comes from. The
price movement is represented by what looks like a candlestick. The wicks or
shadows on either end of the candle represent the High and Low for the day. The
body of the candle represents the opening (or the previous days close) and the
closing price. An up day is represented by a hollow or white candle, while a
down day is represented by a solid or black candle. On trading days that gap up
from the previous days trading the low will represent the bottom of the candle
conversely on days that gap down the high will represent the top of the candle.
The Chart below also contains Stochastics.

There are a number of charting patterns to look for when interpreting the
Japanese Candlestick charts.
- Engulfing Patterns
- Piercing Line
- Dark Cloud Cover
- Hanging Man
- Hammer
- Tweezer Bottom
- Tweezer Top
- Doji Star
- Shooting Star
- Morning Star
- Evening Star
- Upside Gap Two Crows
- Harami Lines
- Harami Cross
Back to Stock Indicators
|